Table of Contents
Introduction
The purpose of the NeuroSeq website is to allow one to quickly extract information from RNASeq data. Currently you can:
- Heatmap: compare mean expression levels of genes across selected cell types
- Coverage: visualize expression coverage over any genomic region
- Atlas: view the anatomical distribution of genetically labeled cell types
Heatmap Viewer
The Heatmap plots relative expression on a color scale for a matrix of selected genes or isoforms (rows) and samples (columns). Genes or isoforms can be specified by gene symbols, entered into the search box. Genes can also be specified by the output of statistical operations comparing sets of samples such as T-test, mean, min, max, ANOVA etc. Sample selection can be also flexibly specified. The full capability is provided through an "Advanced Filtering" format (see Script Example section), but many of these features are also available through a GUI that requires no scripting knowledge.
Sample Names
The sample name encodes information on anatomical region, transmitter, mouse line used, sex and age of the animal in the following format:
(anatomical region)_(transmitter)_(mouse line)_(male/female and postnatal age)_(sample id).
The group name encodes information on anatomical region, transmitter, mouse line in the following format:
(anatomical region)_(transmitter)_(mouse line).
Notes
(anatomical region)uses the Allen reference atlas ontology. Sometimes slight customizations are used, which are indicated by the "@" symbol.- For retrograde injection labeled samples, the
(mouse line)component is suffixed by ".inj".
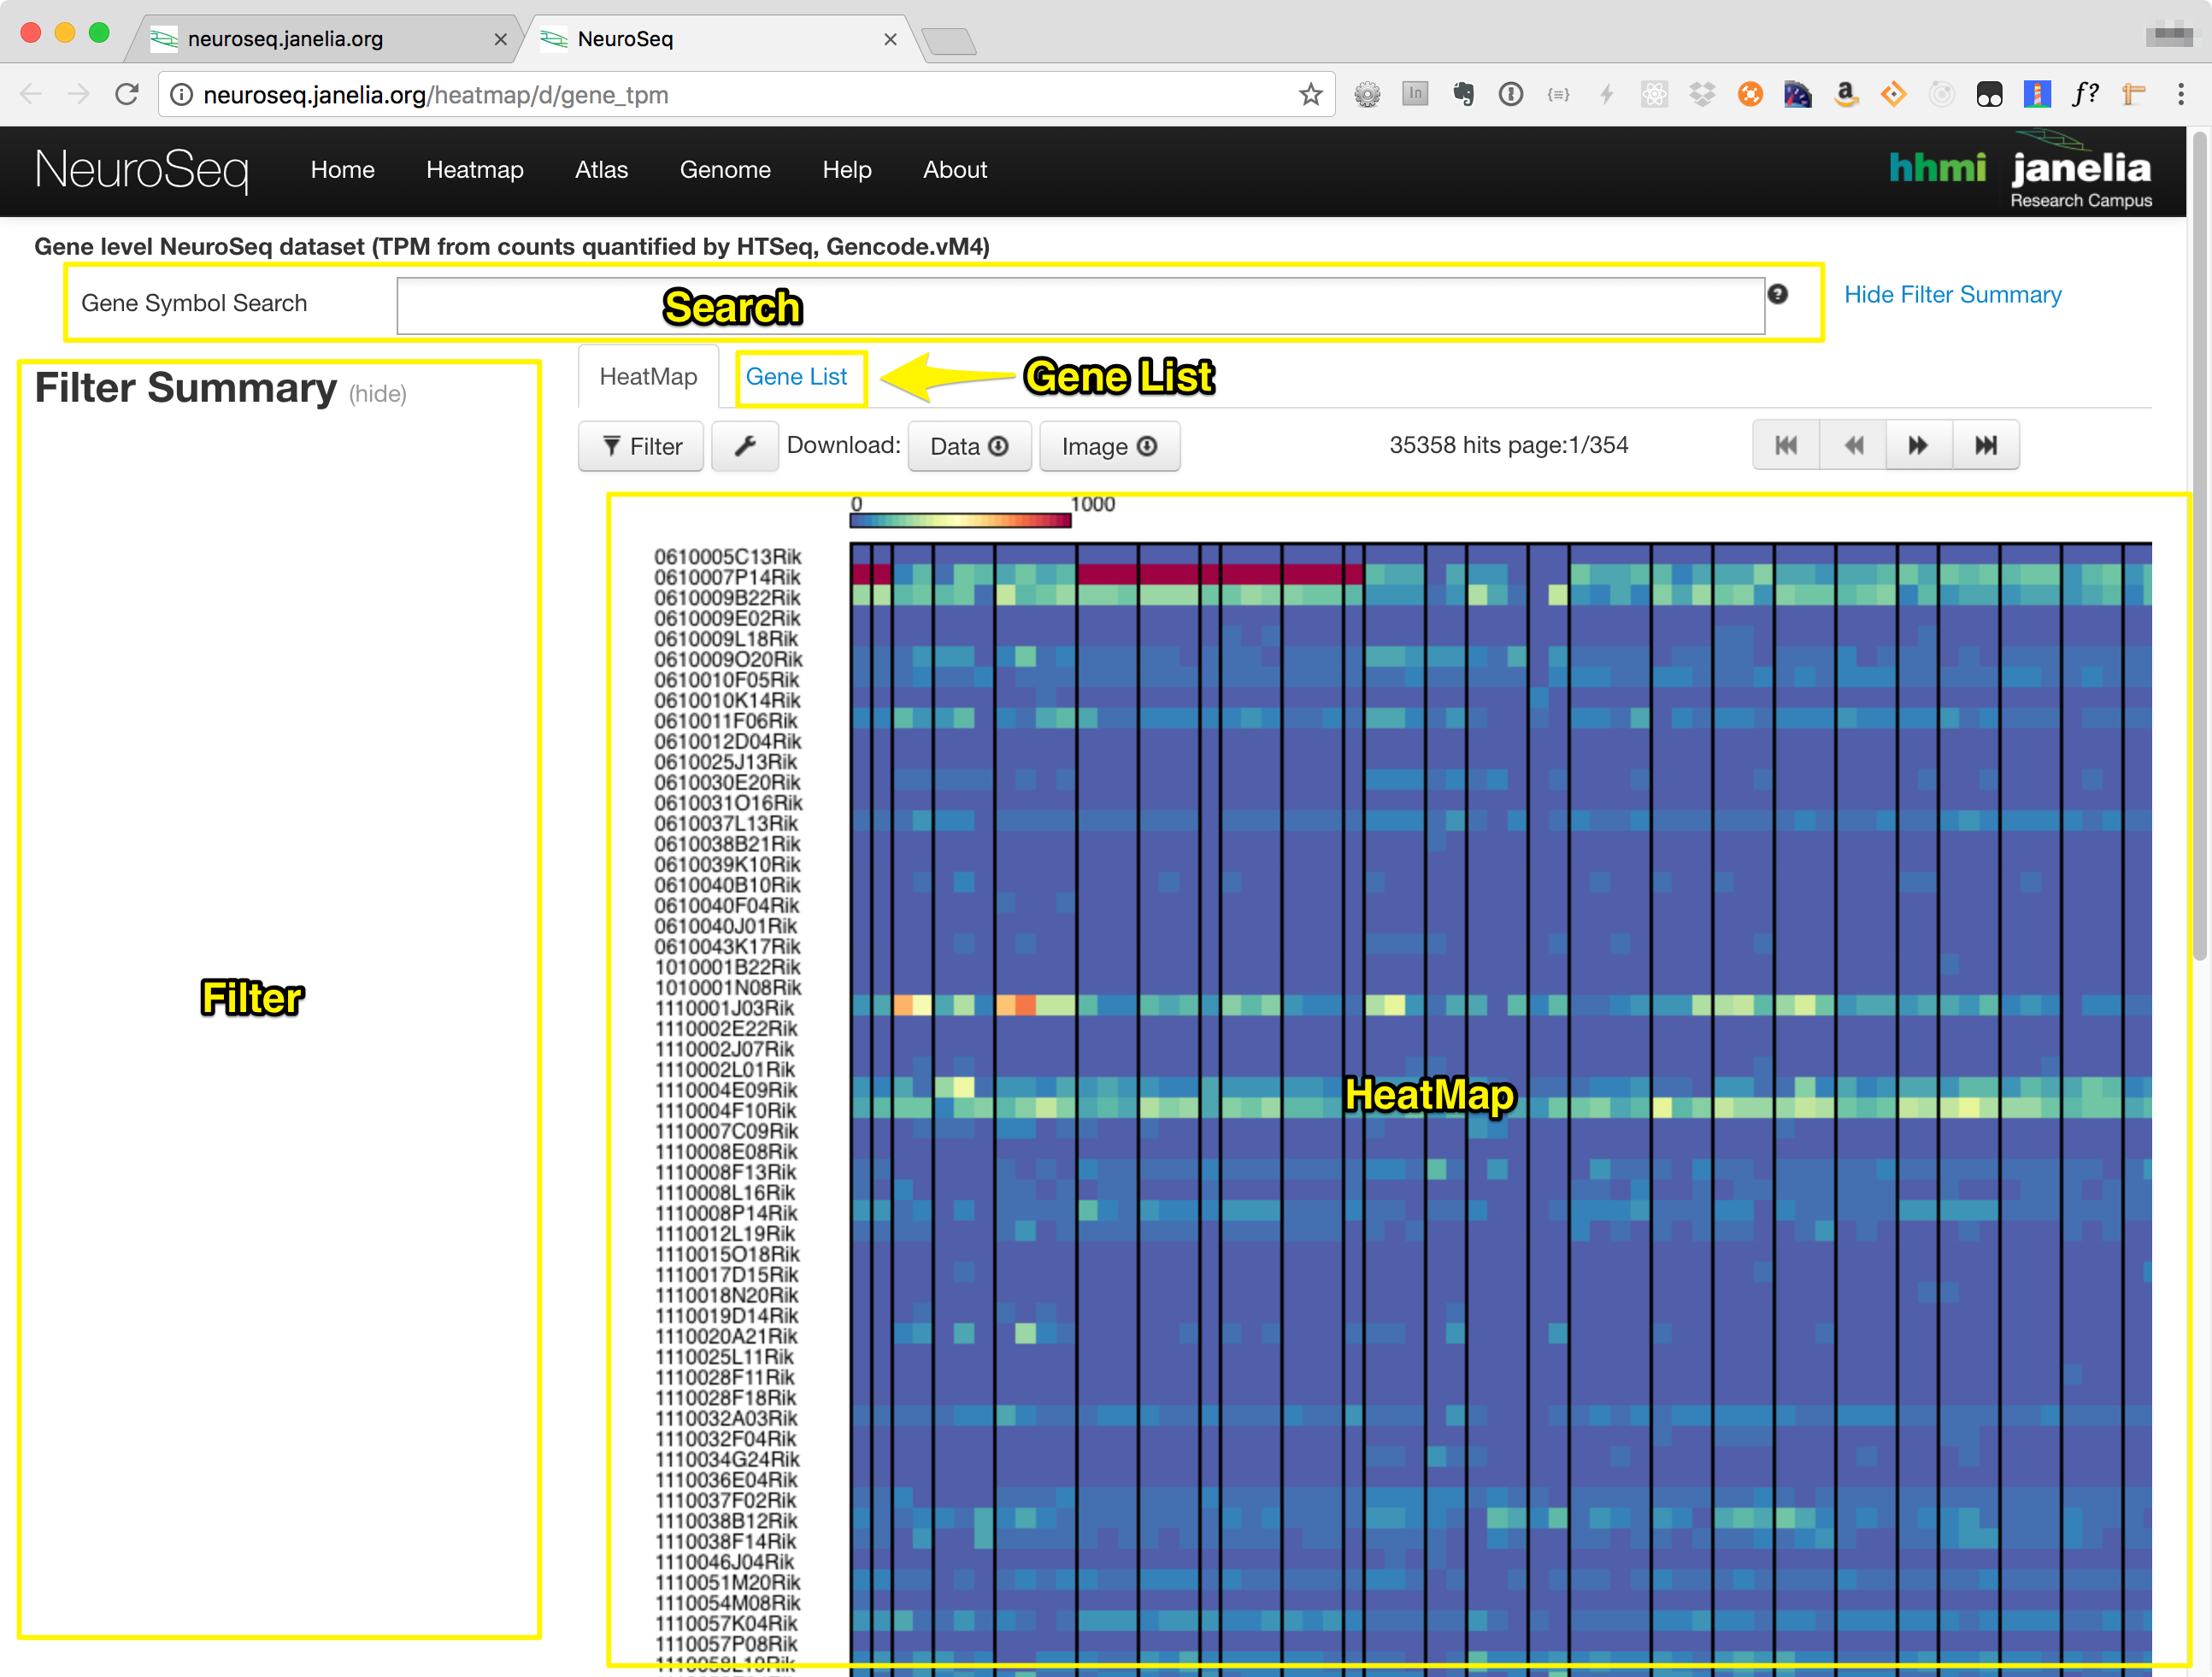
Heatmap Components
The heatmap consists of the components in the following list, also labeled in the image below.:
- Search Box
- Filter Section
- Heatmap Tab
- Gene List Tab
Searching and Filtering
- Gene Symbol Search
- Use the gene symbol search field to narrow the gene list to the genes that you are
interested in. It uses an autocomplete system to help you find the correct gene names,
based on a few characters. Additionally, you can paste in a comma separated list of
gene names and if correct, they will be added to the selection.
eg:
Atad1, Atad2The heatmap will be immediately updated once the selection has been confirmed. - Filters
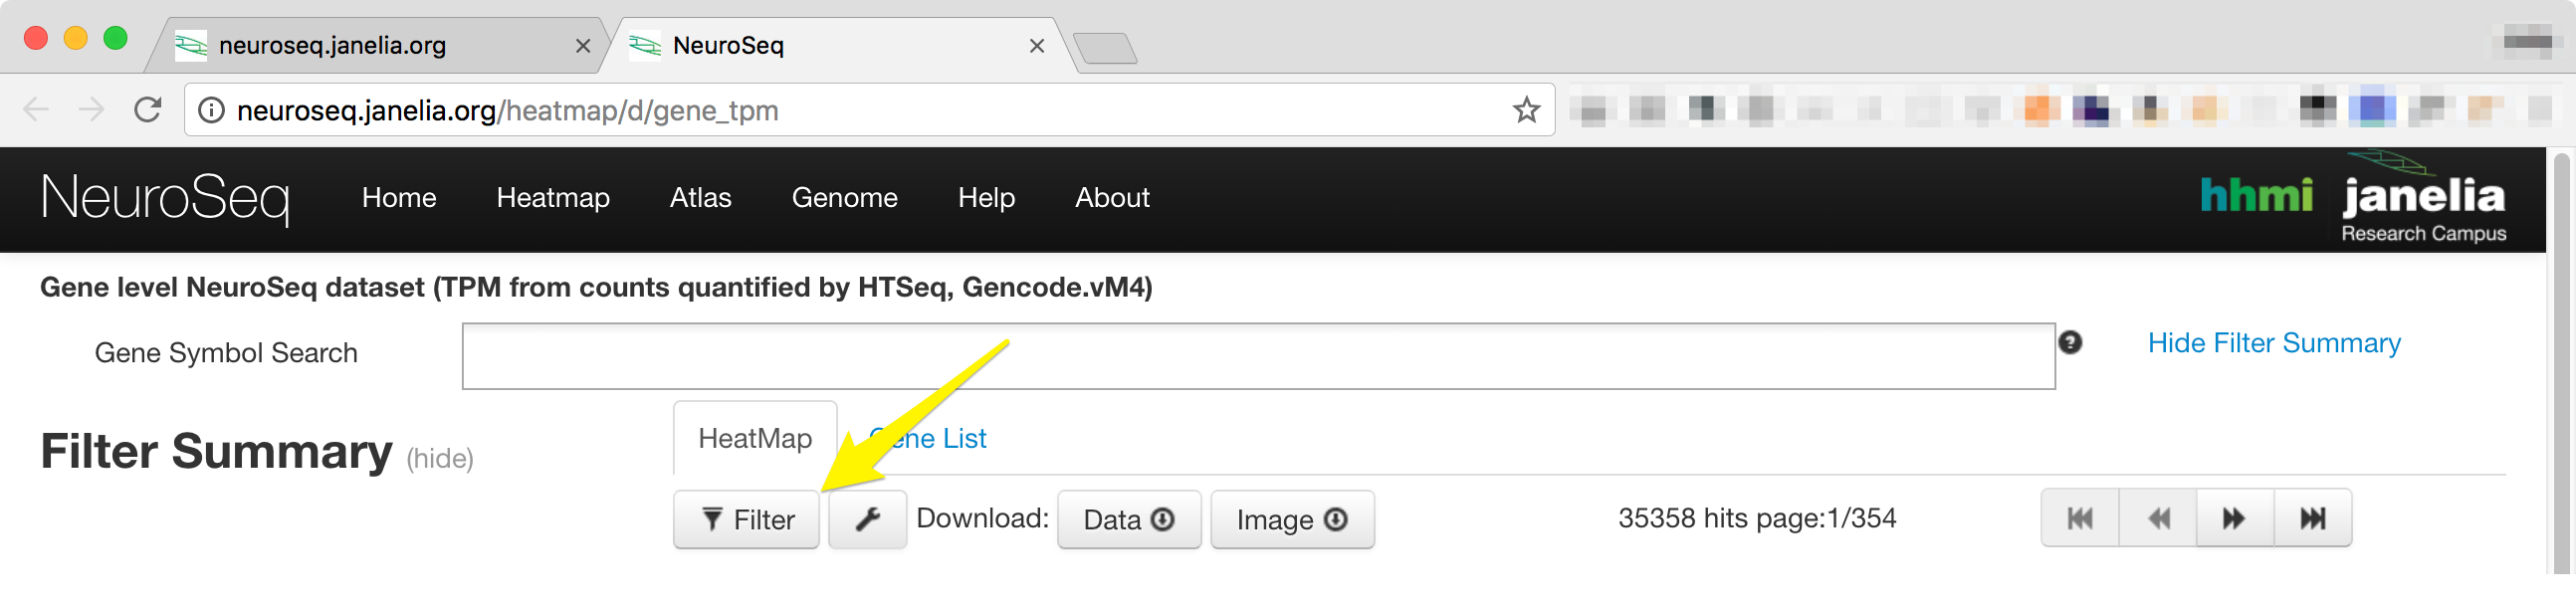
- The filter controls can be accessed by clicking on the filter button just below the 'HeatMap' Tab.
-
Clicking on the 'Filter' button will display a window that contains four tabs, 'Sample', 'Statistics', 'Sort and Scale', and 'Advanced'. Each tab can be temporarily deactivated by unchecking the 'Enable All' check box.
Sample
The 'Sample' tab can be used to narrow down the results to the samples of interest in a similar way to the gene symbol search on the main page. Type in a search term to filter the samples shown in the table below it. The samples displayed will be selected by default, however, you can unselect individual samples by unchecking the checkbox to the left of the table. Once you have your chosen samples selected, you can hit the filter button at the bottom of the modal or move on to one of the other tabs to apply additional filters.
Statistics
The Statistics tab provides the most options for filtering the dataset. On initial load of the page, there will be a single dropdown menu. Selecting a test from that list will present another form that requests the information needed to perform the analysis.
For example, selecting the 'Fold Change' test will display the following form.

Multiple tests can be run on the dataset by selecting them from the original drop down menu. Removing a test is done by clicking on the 'X' icon at the far right of the test section you are interested in removing.
Although the tests can be added to the form in an arbitrary order, they will be executed on the dataset in the following specific order.
- Minimum
- Maximum
- Mean
- Fold Change
- Standard Deviation
- T-Test
- ANNOVA
If you wish to execute tests in an alternative order, please use the advanced filter interface documented below.
Sort and Scale
On this tab you can sort the genes and samples based on a number of criteria. By default genes can be sorted according to their median expression values or alphanumerically by symbol. If a statistical analysis was performed on the 'Statistics' tab, then an entry representing the results of that analysis is added to the list of options and can be used instead of the defaults.
Samples can be sorted by the results of one of three calculated stats, 'mean', 'min', or 'max' expression levels. In addition to these, they can be sorted in the order they are presented in the paper.
The number of genes to show can be arbitrarily limited by entering a positive integer into the input box below the 'Number of Genes to Show' label.
Scaling the expression values can be achieved by adding a maximum and or minimum value into the 'Scale Values' input boxes. Once filtered all expression levels will fall within that range.
Finally, the 'Standardize Values' checkbox can be used to rescale all the expression values to have a mean of zero and a standard deviation of one.
Advanced
The advanced filter provides a textarea where a basic script-like language can be used to apply filters in an arbitrary order. This is described in more detail in the section below
Advanced Filtering
The final section of the filter control is the 'Advanced Filter'. Using the text area on the left you can apply filers in any order you wish, with very basic variable declaration. Once a filter has been applied, you will be immediately directed to the heatmap. Returning to the advanced filter will reveal the results of the functions in the grey area on the right. This can be used to determine if the functions executed correctly and how many samples were filtered out at each stage.
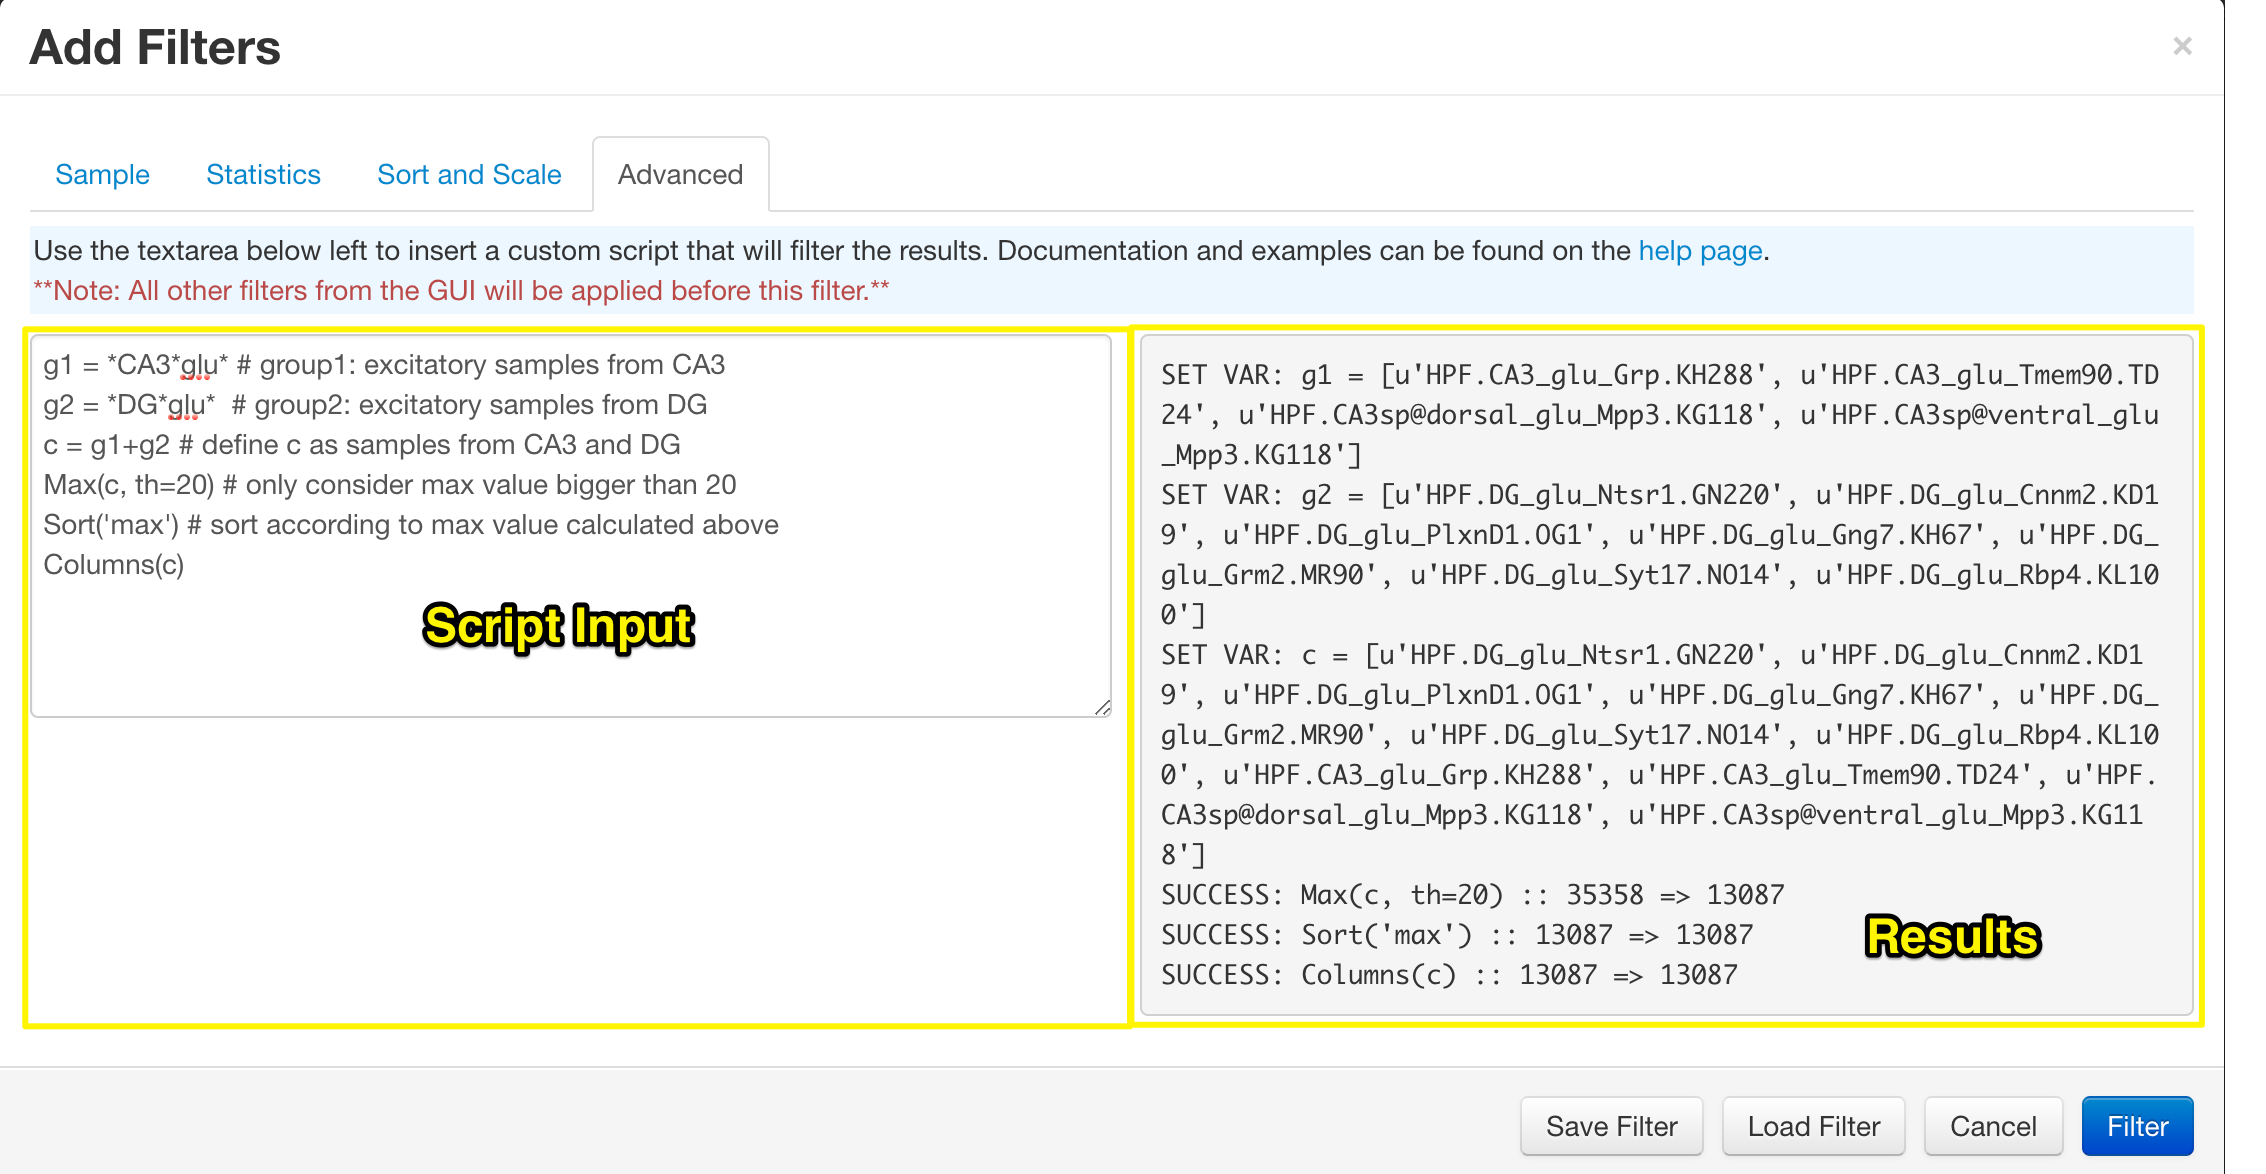
See the Advanced Filtering help page for more details on the functions and accepted input.
Interpreting the Heatmap
- Wrench (Settings) - change color range, size of squares, colormap type, scale.
- Pop ups
- Download buttons
- Pagination
Gene List
- Table listing of all the genes
- Gene Detail
Atlas Viewer
The Atlas viewer provides zoomable images of patterns of label cells of most mouse lines used to access profiled cell types. Brain regions profiled are described in [need reference to table here]. Some of the lines used are not included but images are available through GENSAT, the Brandeis Enhancer Trap Line Browser or the NIH Blueprint Cre Driver project
The atlas consists of three main components:
- Search and Functions Section
- Photos Tab
- View Tab
Search and Actions Section
Use this section to narrow down the list of lines by searching for keywords. Additional actions allow, selecting all or none of the lines, downloading the information in a list and collapsing or expanding the lines table.
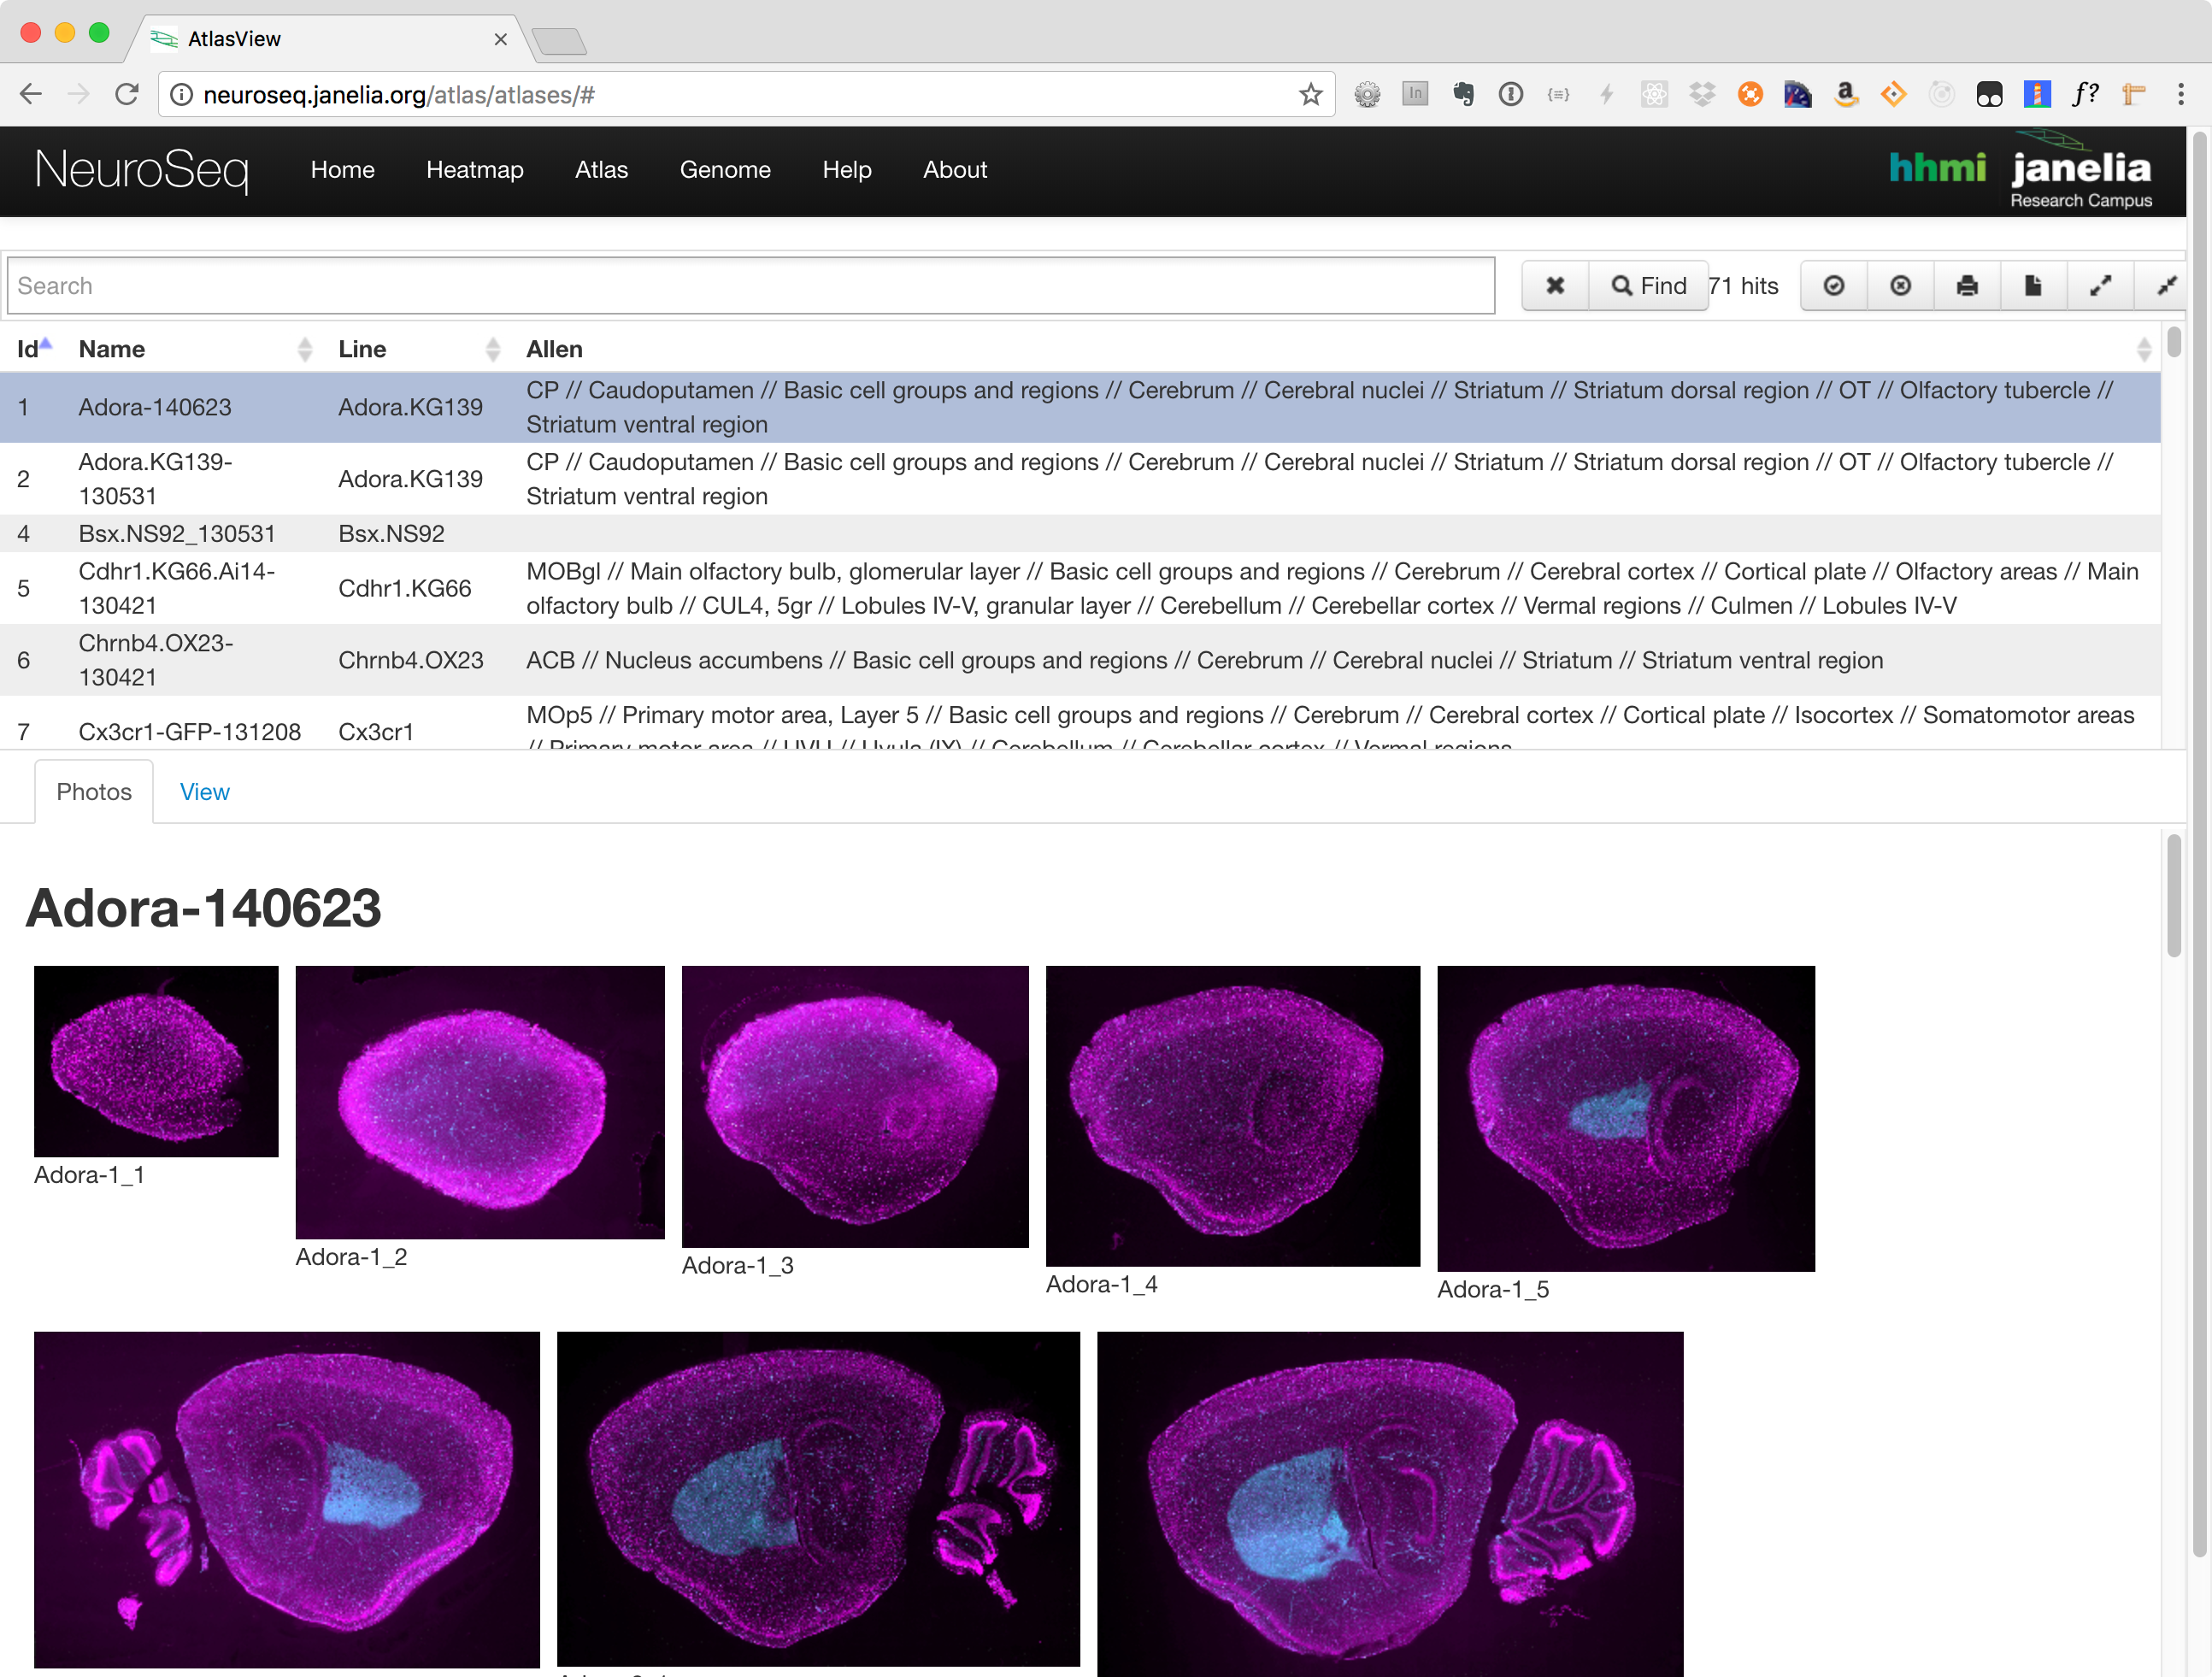
Photos Tab
The photos tab is used to view images of the selected lines. Once a line has been selected, a number of thumbnails will be displayed in this section. Clicking on one will launch an image viewer that provides panning and zooming functions making it possible to see some of the finer details.
Note: Currently Adobe Flash is required to access the image viewer.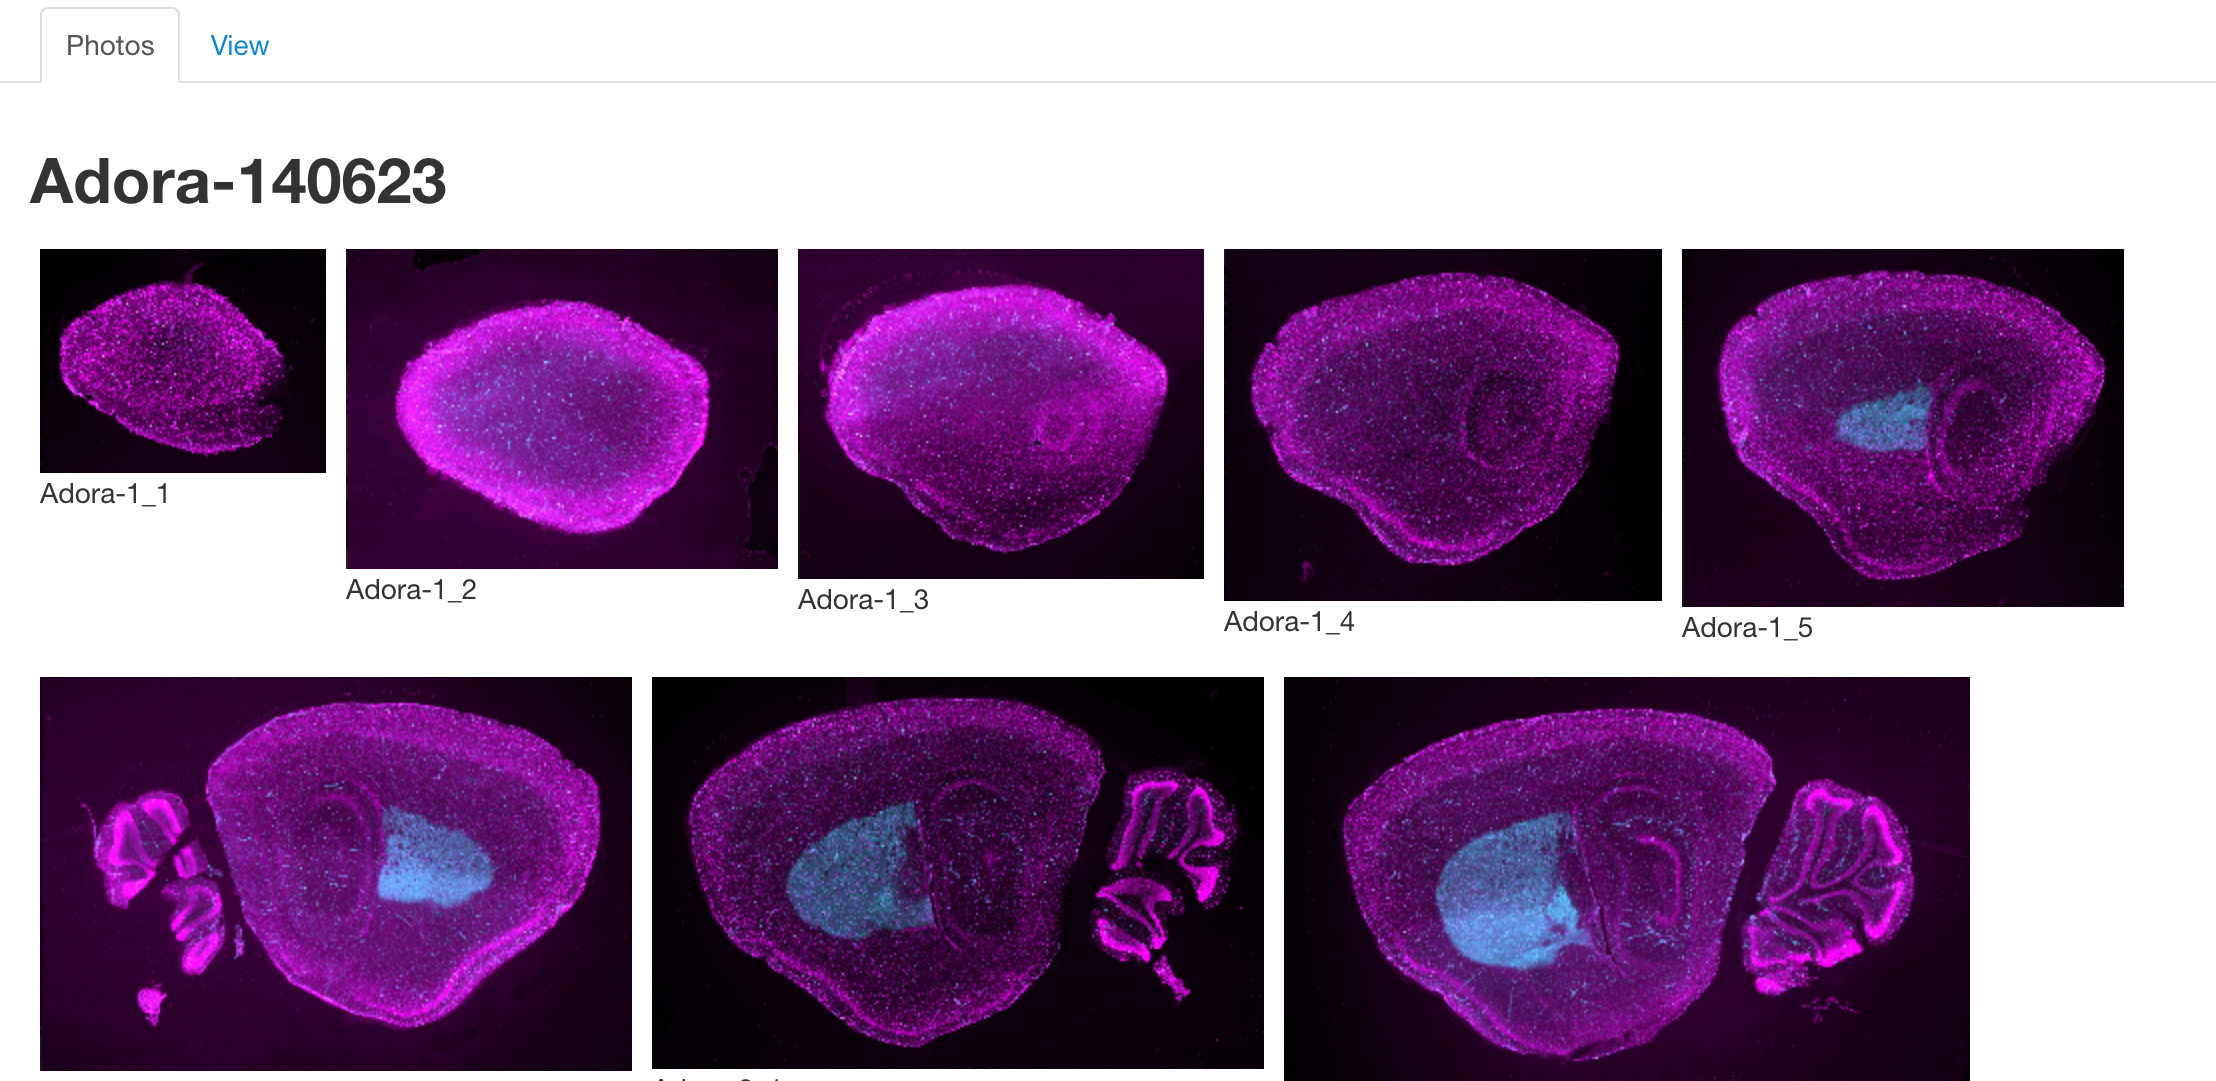
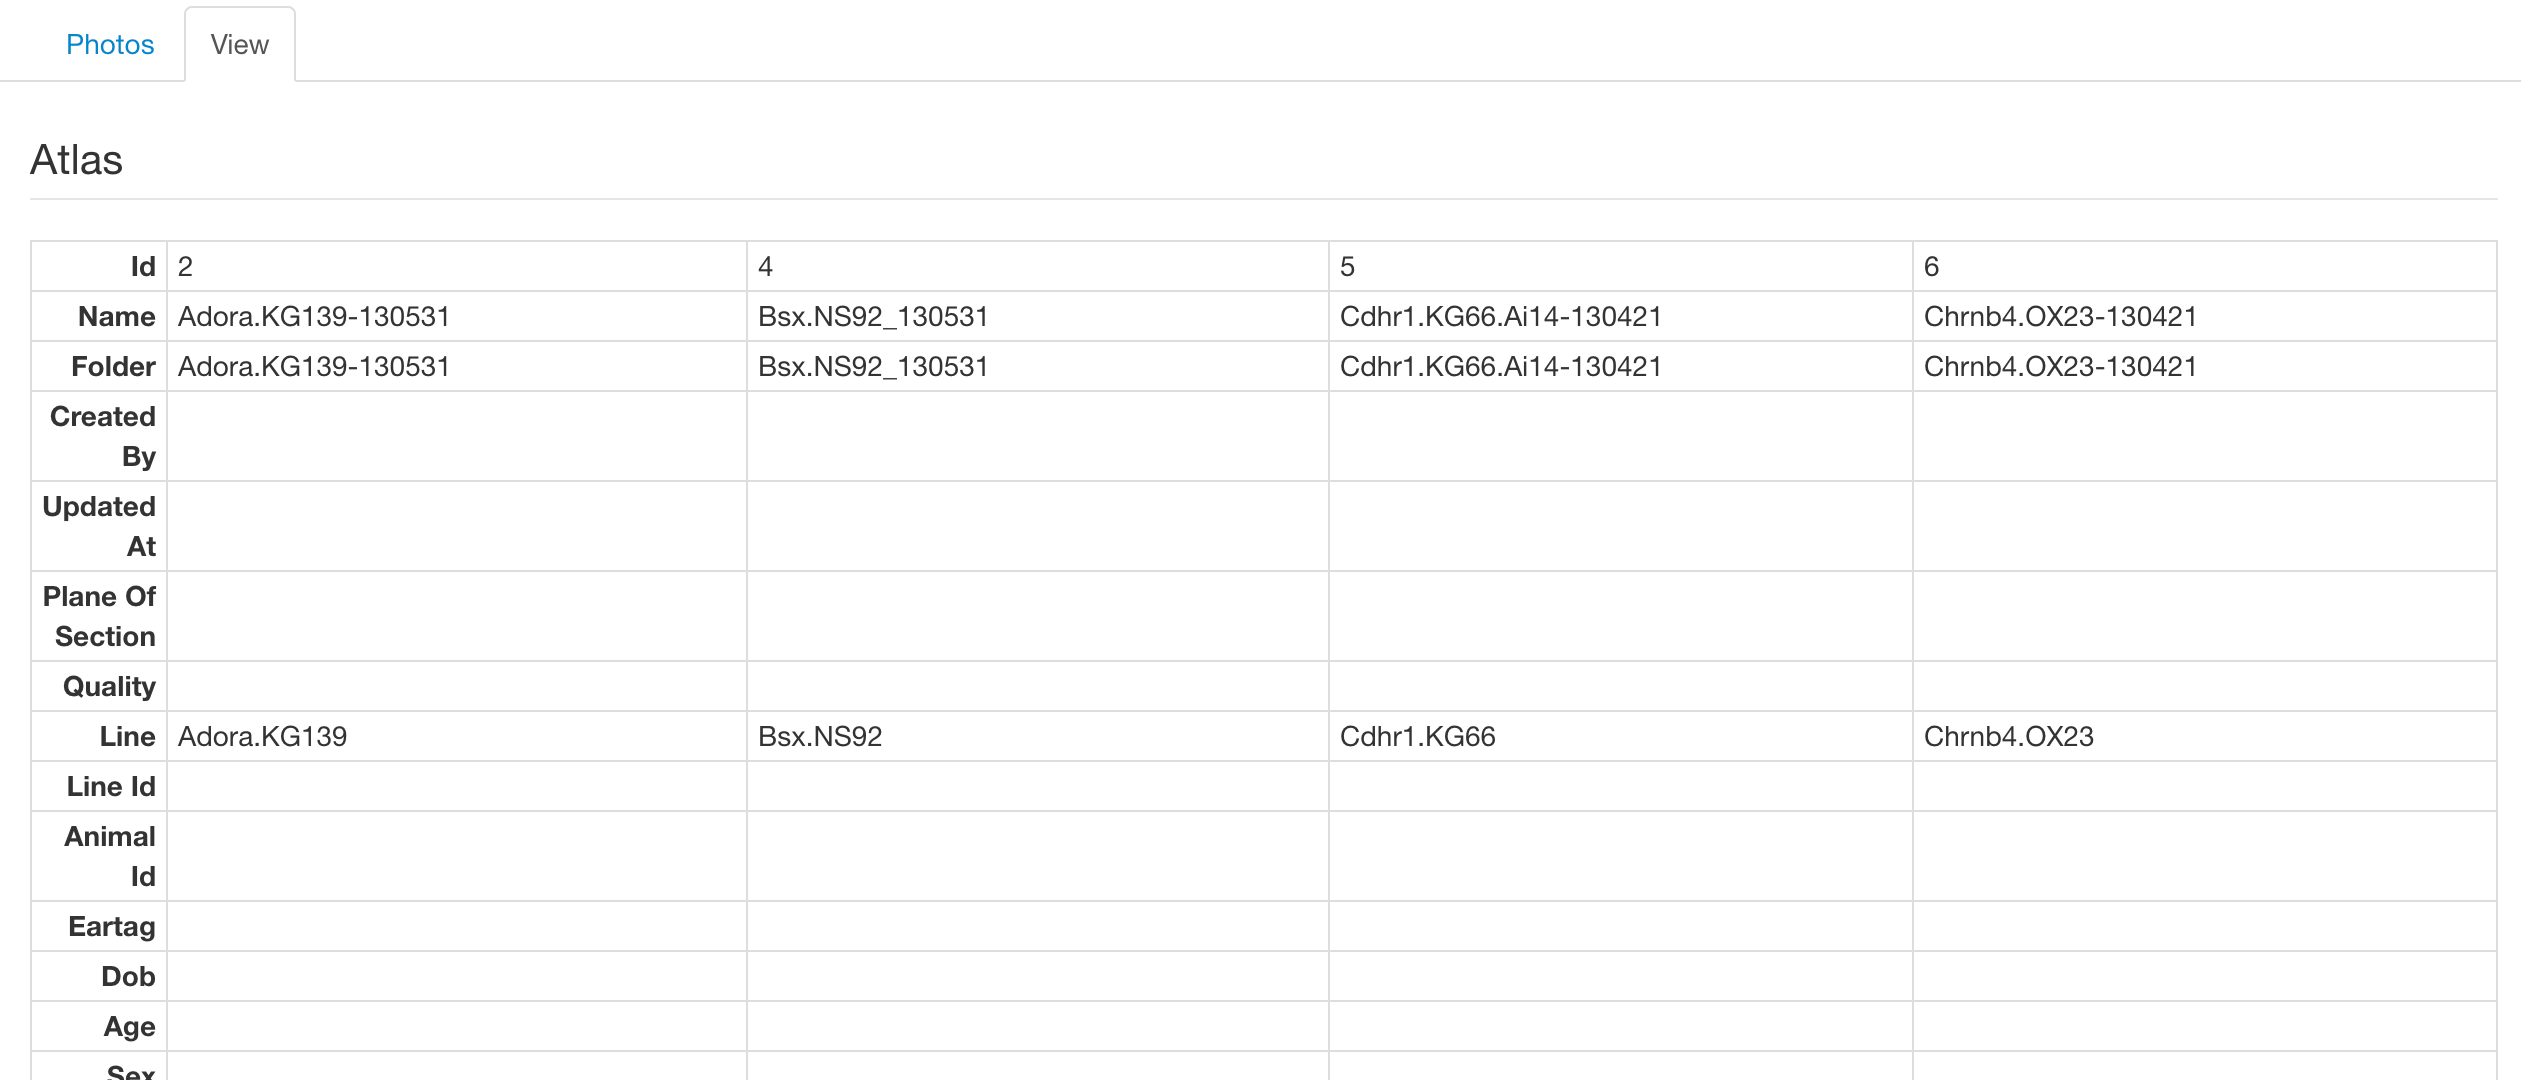
View Tab
On this tab we present the meta data associated with the selected lines, such as perfusion date and Allen regions. Shown below is an example of selecting more than one sample which renders the lines in a grid, allowing easier comparison between them.
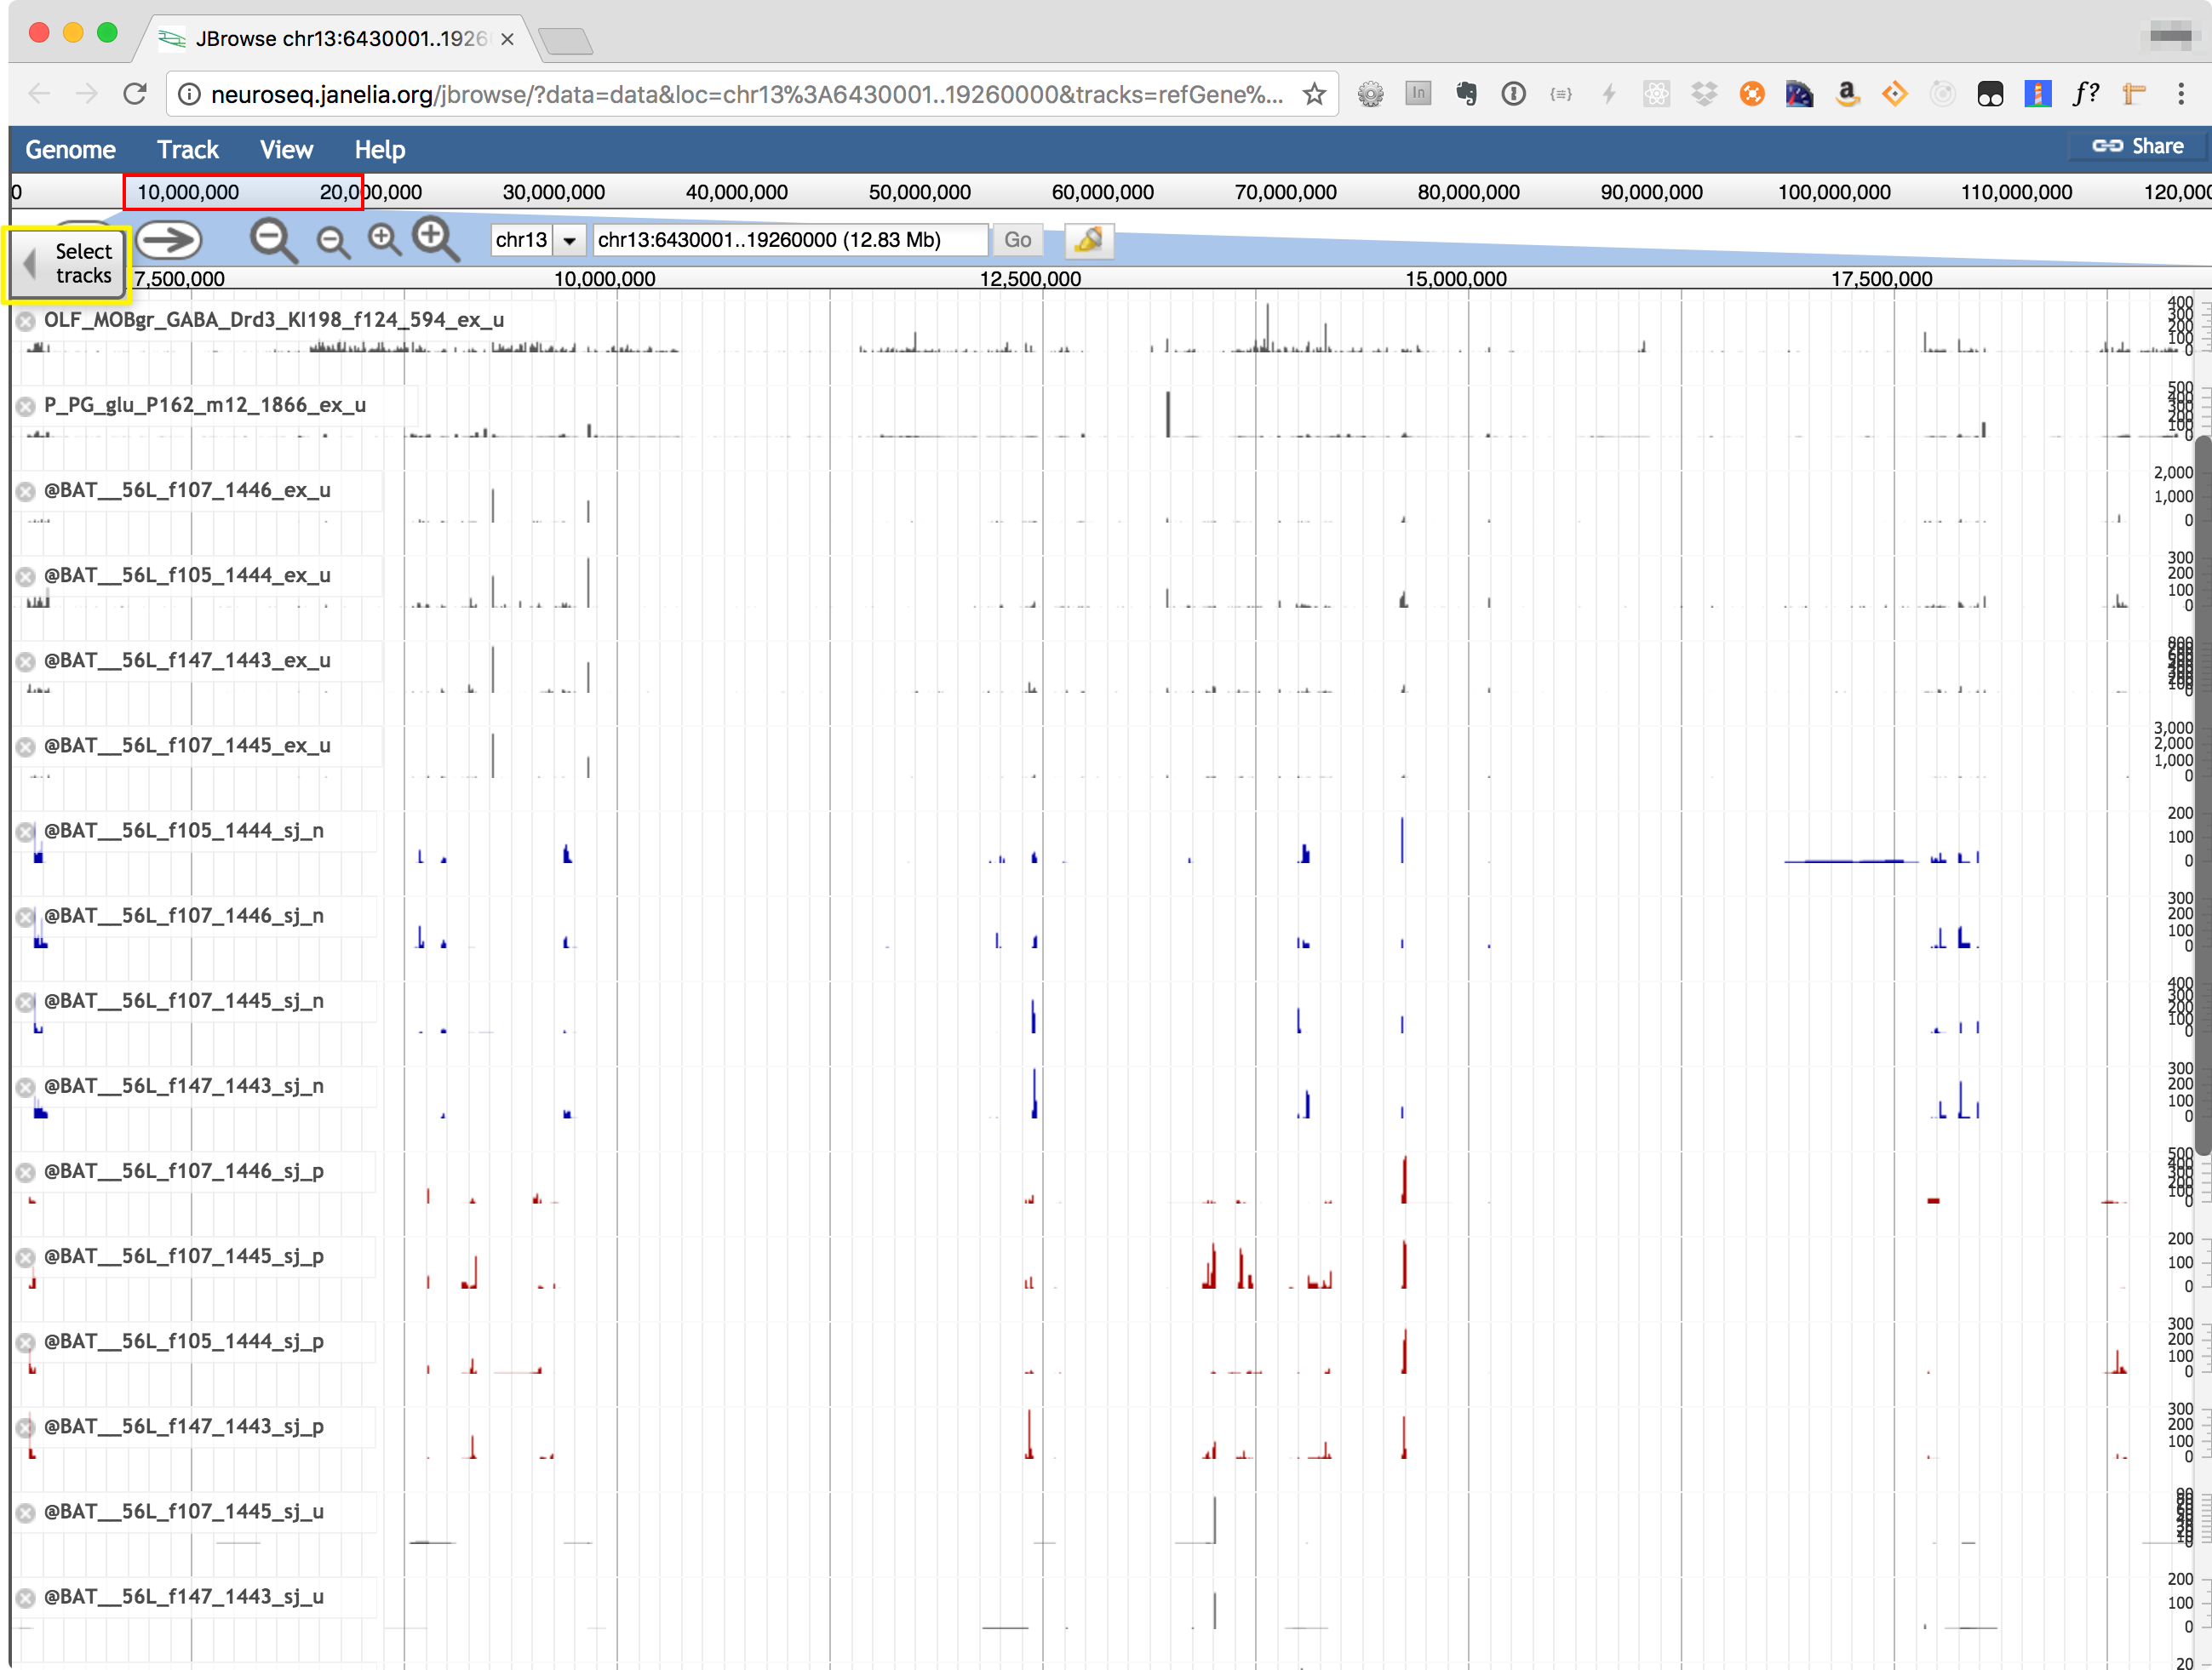
Coverage Viewer
The Coverage viewer shows read coverages mapped to any selected genomic region, using JBrowse (https://jbrowse.org/). The genomic region may be selected by entering coordinates (or a gene name) in the coordinate box at the top of the display. Use "Select Tracks" tab, highlighted in the image below to choose which samples to display. Transcript models from refGene, Cufflinks, StringTie and a new assembler called jGEM are also shown.
© 2016 Janelia Research Campus | 19700 Helix Drive, Ashburn, VA 20147 | (571) 209-4000